We turned PMAX off in 26 states for four weeks. Here is what went missing.
We paused PMAX in 26 US states for four weeks and measured what went missing from the order system: 1.17x per net dollar against a 2.22x break-even, inside the noise band at 76%. The design, the drift, the robustness checks and what we decided.
Craig Graham
•
November 3, 2026
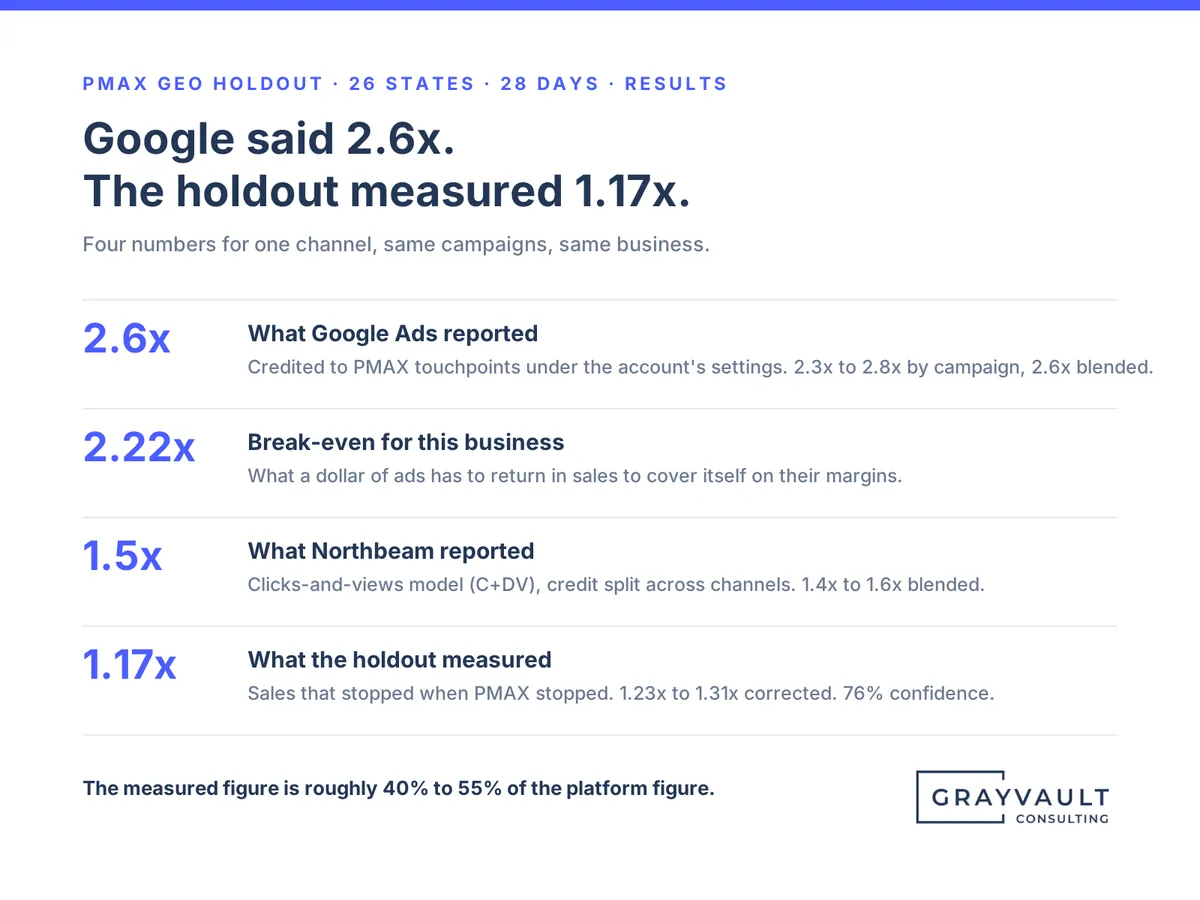
One of our ecommerce clients had three different return numbers for the same channel. Google Ads reported PMAX, which in this account is a channel made up of several campaigns, at 2.3x to 2.8x return on ad spend by campaign, about 2.6x blended.
Northbeam, which the account uses for attribution across channels, had the same campaigns at about 1.4x to 1.6x. Break-even for this business is between 2.12x and 2.22x depending on which variable costs are counted, and this piece uses 2.22x, the stricter of the two. So depending on which report you believed, PMAX was either comfortably paying for itself or losing money on every dollar, and the gap had been there for several months.
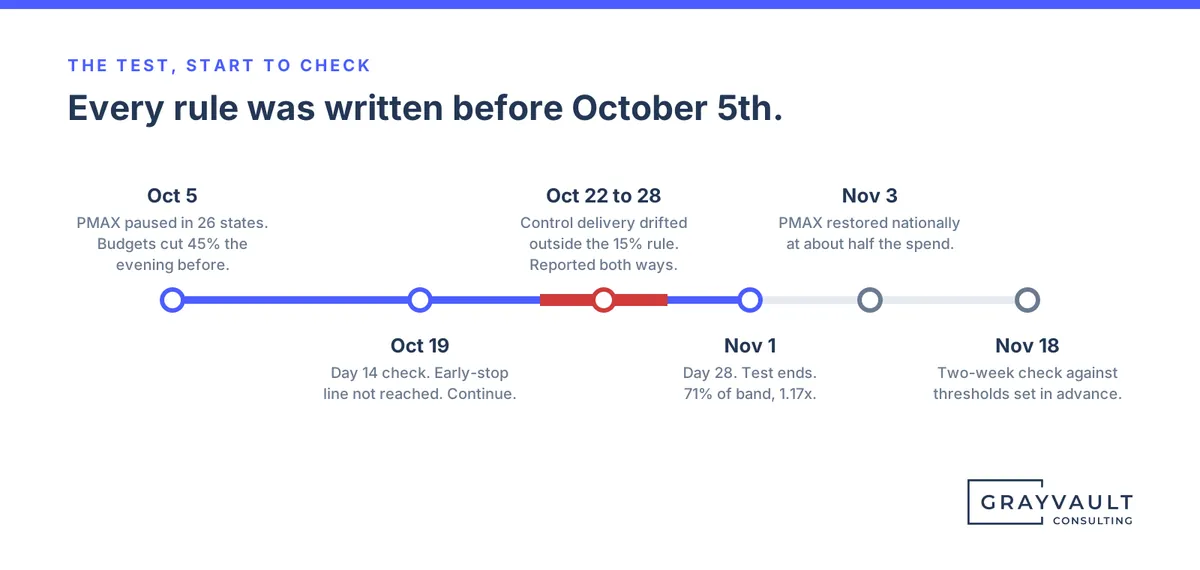
So, on October 5th, we turned PMAX off in 26 US states and left it running in the other 22. The test ended November 1st. The states where PMAX was off sold about 18% less than we predicted they would have, which works out to 1.17x in sales for every net dollar not spent, or 1.23x to 1.31x after a sensitivity correction for a bidding drift in the comparison states. The confidence that the shortfall is real is 76%, below the 90% bar we set before the test, so this write-up calls the result probably real but not conclusive. The chance the true return is at or above 2.22x is about one in seven on the raw figure and about one in six on the corrected ones. Every leave-one-out rerun came in at or under 1.5x, and the corrected central figures under 1.31x, all well below what the platform reported. The direction held in every cut of the data; the size did not, because three states carried most of the gap, and that is covered below.
The budget decision was made on the number that the test uncovered, and the test number is now the anchor for PMAX in the marketing mix model being built for the account. Everything below is how we got there, in enough detail to see how it was built.
The short version
PMAX was paused in 26 US states for 28 days (October 5th to November 1st) and left running in 22 matched states.
The paused states sold about 18% less than predicted, which is 1.17x in sales per net dollar not spent, or 1.23x to 1.31x after correcting for a control-group drift.
Break-even is 2.22x. Google Ads reported 2.3x to 2.8x. The measured figure came out at roughly 40% to 55% of the platform figure.
Confidence is 76% against a 90% bar, so probably real but not conclusive. The 90% range on the measured figure is wide, roughly −0.5x to 2.8x, and the chance PMAX clears break-even is about one in seven.
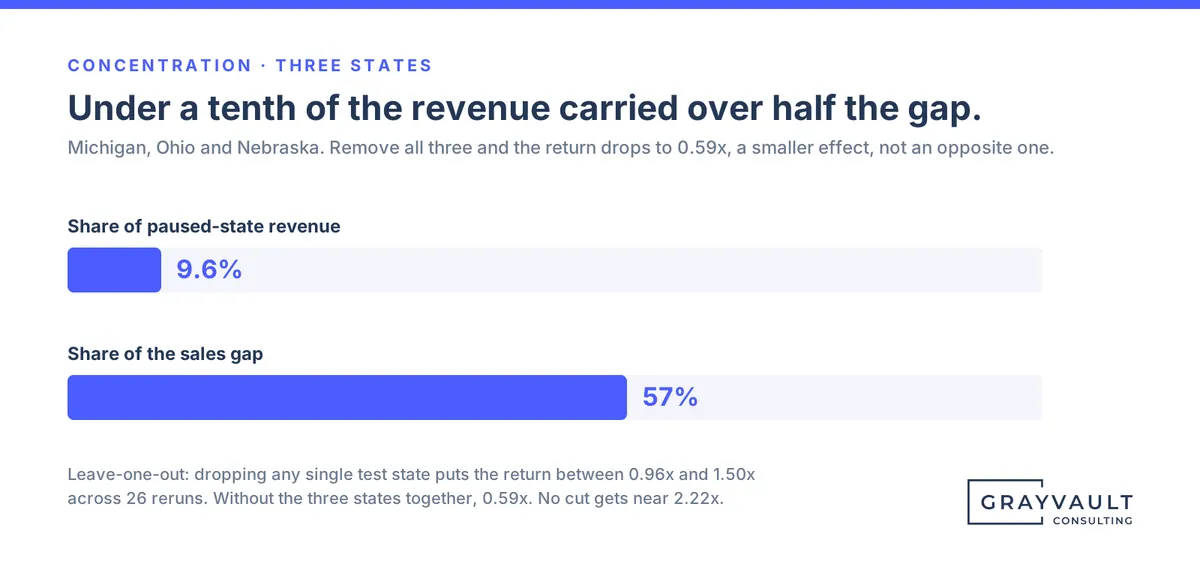
Three states carried 57% of the gap on under a tenth of the revenue. Without them the return is 0.59x at 38% confidence, so the test does not pin down the size of PMAX's contribution, and one of the three had been running well above its forecast before the test.
Together with the client, we brought PMAX back at about half the spend with a higher target and a two-week check on November 18th.
Why we ran it
PMAX had been about a third of total paid media spend, in an account where paid media is one of the largest expense lines in the business. It had been running for years, had been restructured more than once and optimized regularly, and Google's figure for what it returned was still roughly two thirds higher than Northbeam's. Neither tool could settle it, because both measure the relationship between seeing an ad and buying. Neither can say how much those ads caused or influenced the purchase, which is measured by watching what happens to sales when the ads stop altogether.
The finance team needed one number to use for planning, and the business needed more certainty for spending decisions. So, we created a geo holdout test to settle that with data and measurement.
Three numbers for one channel
Before the design, it is important to be clear about what each number was counting, because none of the three was technically wrong.
Google's reporting credits sales to Google Ads touchpoints inside its attribution window, and nothing in that report subtracts what Meta, email or organic did along the way. If someone clicked a PMAX ad on Tuesday and bought on Saturday, Google's report credits that sale to Google Ads. On this account, that came to 2.3x to 2.8x by campaign in the two weeks before the test, about 2.6x blended.
Northbeam's clicks-and-views model (C+DV) counted touches across every channel at once, so a sale that Meta, email and PMAX all touched gets deduplicated and credited across the paid channels in the mix instead of being claimed in full by each one. Over the same two weeks, Northbeam had PMAX at about 1.4x to 1.6x blended, depending on the accounting mode (accrual or cash), and 1.2x to 1.8x by campaign.
The holdout counted only the sales that stopped when PMAX stopped. 1.17x as measured, 1.23x to 1.31x corrected.
Credit being split across channels, attribution windows and accounting dates all feed the gap between the first two, and this piece does not try to apportion it. The gap between the second and the third is the part no attribution tool can see, which is sales that would have happened anyway. This business sells a high-value automotive product with a long consideration window, so a lot of buyers are on their way to an order before any ad finds them. A PMAX ad placed in front of one of them gets credit from both tools but doesn’t actually influence the purchase decision.
When you put the three together, the test figure divided by the platform figure comes out between roughly 40% and 55%, depending on which campaign and which version of the test figure you use. That ratio compares a pre-test attributed number with an in-test incremental number measured per net dollar, so it is a rough haircut rather than a measured share, and it is used as one below. The way I think about it is that the platform number is a read on what the channel touched, the attribution number is a read on how credit gets split across channels, and the incremental number is the only one that answers what happens to sales if you stop spending. Budget decisions need the third one. The first two are still useful, but they answer different questions.
Why October, with Black Friday eight weeks away
October is a quiet month for this business, so the cost of turning off a major channel in half the country was about as low as it was going to get. The same test in November would have cost a lot more in lost sales, and it would have been hard to read against the Black Friday swings.
The result also had to exist before the November budget decisions were made. Four weeks of testing, a short restore window, and a write-up two days after the test ended leaves about three weeks before Black Friday, with the November 18th check in the middle, to set holiday spend based on a measured number instead of a platform number.
The trade-off is that October's low volume means a wide noise band (the range of week-to-week variation you'd expect between two groups of states with nothing changed) relative to the effect we were looking for. So, we sized the test to answer whether PMAX was at break-even or better versus well below it, and we did not try to measure a small effect precisely. That was the question the budget needed answered.
Why an account this size could run this at all
There's a common belief that holdouts are only for brands spending a million dollars a month or more, and that below some threshold the noise is bigger than the signal and you shouldn't bother. I hear it from media buyers and from clients, and the spend threshold usually gets quoted without saying what it is actually for.
The threshold is about effect size, not spend
The threshold is real, but it's about the size of the effect compared to the noise, and it's not really about spend. A test has to be able to see the effect you care about above the normal week-to-week drift between two groups of states. If the question is whether PMAX is returning 1.2x or 1.5x, you need a lot of volume to tell those apart, and on this account four weeks wouldn't have done it. But that was never the question we were asking.
The question was whether PMAX was returning what Google said it was. If Google's number had been right, the sales missing from the paused states should have been roughly twice what we actually saw, and a gap that size sits outside the noise band. Anything well below break-even and anything around zero both answer the budget question the same way, which is why we didn't need to separate them.
Three things that made it possible here
There were three other things that made this possible on an account of this size.
First, PMAX was one large line in the budget and not ten small ones. The bigger a single channel is relative to the account, the bigger the effect you're looking for, and the less spend you need to see it. A mid-sized account with one large channel is a better test candidate than a much larger account that is spread thin across twenty campaigns.
Second, the outcome came from the order system by shipping state, and not from the ad platform. Daily revenue by state is something most ecommerce stores already have on hand. You don't need a data science team to pull it, build a prediction from the pre-test weeks, and add up the gap each day, and the tooling to do that is a lot more accessible than it was a few years ago. In my experience that accessibility is what has changed most since the rule of thumb took hold.
Third, October was quiet, which cut the cost of being wrong. The spend we withheld stayed in the bank. The real cost of the test was the incremental sales we gave up in the paused states for four weeks, and that cost is bounded by the very thing you're measuring. If PMAX was returning what Google said it was, the test would have been expensive, and the day 14 check was there to catch a large effect before the full four weeks ran. If it wasn't, the test cost very little. That is what the early-stop rule was for.
Where the threshold argument is right is at the small end. An account spending a few thousand dollars a month across Google, Meta and Microsoft is unlikely to be able to run this, because no single channel is large enough to see against the noise. The more accurate version of the rule is that you need one channel big enough that removing it would show up, in a period quiet enough that the band stays narrow, with a decision that only needs a coarse answer. In my experience that describes more mid-sized accounts than people think.
How the test was designed
We split the 48 states where PMAX was running into 26 test states, where PMAX was paused, and 22 control states, where nothing changed. Arkansas, Mississippi and DC were already excluded from PMAX before the test, so they could not be in either group. Canada was left alone.
The split came from 20,000 random candidate splits with the test side holding about half of PMAX spend, ranked by how closely each pair of groups tracked each other across the full pre-test period, with the best one kept that also balanced product mix and last year's revenue path.
The pause itself was done with location exclusions on the PMAX campaigns, targeting set to presence only. Daily budgets were cut by about 45% the evening before to match the share of US PMAX spend those 26 states had been carrying, so the running states did not simply absorb the money. Branded search was already excluded from PMAX on this account, with separate brand Search campaigns catching those queries, so the result is not brand traffic being relabelled.
The design document was written down and shared with the client before anything changed, and it fixed everything that could later be argued about:
The state lists and the four-week window (October 5th to November 1st).
The outcome measure: store order revenue by shipping state, paid orders only, cancelled orders excluded, refunds applied as they posted, UTC days.
The prediction model, the noise band and the break-even line.
An early-stop line at day 14, in case pausing PMAX was clearly hurting sales.
An operational rule: if PMAX delivery in the control states moved more than 15% from baseline, document it and decide whether to continue.
A decision tree with three branches (keep, trim, cut), written before any data came in.
The prediction came from about 33 weeks of pre-test data. We fit test-state weekly revenue against control-state weekly revenue, which worked out to a constant plus 0.58 times the control states' sales (the 0.58 is specific to this split and this account). We froze that formula at launch and never re-fit it. During the test, each day's actual control revenue goes through that formula to give us what the test states would have sold with PMAX on. The gap is predicted minus actual, added up day by day. We kept the model this simple on purpose, because every extra term is another thing to argue about after the fact.
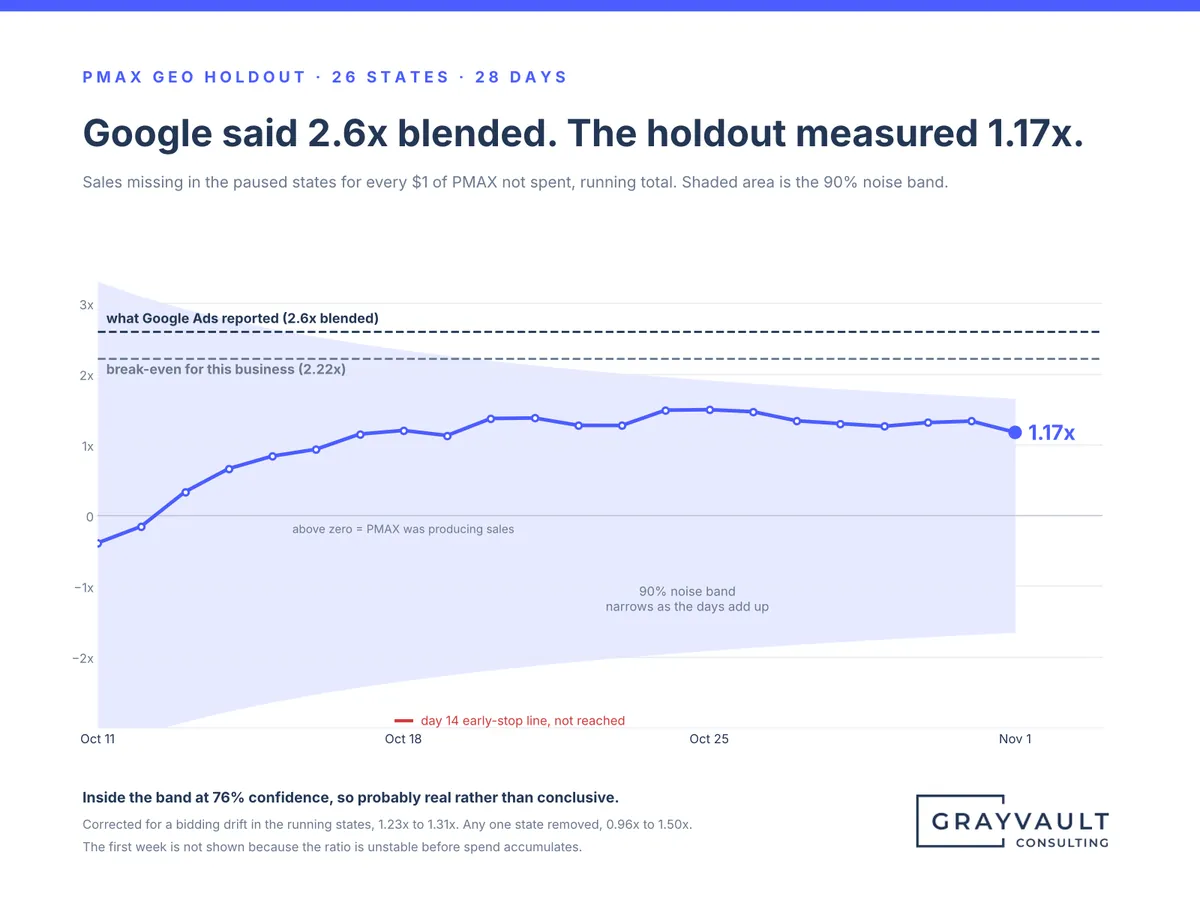
The noise band is a 90% range on the cumulative gap. The split itself was chosen on all 33 pre-test weeks, so to keep the band out of sample it is built from the error of a model fit on the first 23 weeks and tested on the last 10, across the best-balanced candidate splits, with an extra term for drift in the pre-test relationship. That out-of-sample error is about twice the in-sample error of the deployed split, which is why the band is as wide as it is. It widens with the square root of time. At day 28 it was about plus or minus 1.4 times the gap we ended up with.
The band assumes weekly errors are independent, and we did not test the residuals for autocorrelation. If the errors are positively correlated, which is common in weekly sales data, the band is too narrow and the confidence figures generous, so treat them as approximate. Throughout this piece, "confidence" is shorthand for one minus the p-value under that band, which is not strictly the probability that the effect is real, and a "chance the true figure is above X" treats the band as the sampling distribution with no prior, which is how the figures in this piece are defined.
Until the gap is outside the band, what you have is a direction, not a result, and we said that to the client every time we sent a chart.
Return per dollar is the cumulative gap divided by the net spend withheld. Net withheld is the PMAX spend that was not made in the paused states, less what the other Google campaigns picked up in those states, which was 12% (measured as the change in the test states relative to how the control states moved, so the normal drift is taken out). Per gross PMAX dollar removed, before that pickup, the same lost sales work out to about 1.03x. So, the number we measured is PMAX's incremental return on top of the other Google campaigns, and that is the number the budget decision needed. Total contribution from all of Google is a different test, and it's important to be clear about which one you ran.
Every day we checked that test-state PMAX spend was at zero, that control-state PMAX delivery was within 15% of baseline by campaign, and how much the other Google campaigns were picking up in the test states. GA4 revenue by region gave us a second source for the gap. We also ran leave-one-test-state-out across all 26 states (rerunning the analysis 26 times with a different state removed each time), counted how many states in each group came in below their forecast, and ran a sensitivity analysis for the control-state drift described below.
On data handling, the full series was regenerated every run because refunds and cancellations revise history. Order data was stripped of customer details before saving, and raw downloads were deleted after each run. The store's days and the ad platforms' days run on different clocks, which we documented and allowed for.
What happened, week by week
The four weeks ran across four different site promotions, which changed on October 9th, 15th, 22nd and 27th. The promotions were sitewide, so by design both groups saw the same ones, which is the whole point of a matched design.
In week one, the test states came in close to prediction. At that point it looked like PMAX was doing very little, though a flat first week is also consistent with ads shown before the pause still producing orders, in a category with a long consideration window.
In week two, the gap opened up.
At the day 14 check, the gap was at 41% of the band and 1.2x per net dollar. The early-stop line, which we set in case pausing PMAX was clearly hurting sales, was not reached, so the test continued.
In week three, the gap grew at a steady pace. The return per net dollar reached 1.49x on October 25th, and the share of band reached 79% the following day. That growth was spread across the week and overlapped with both a promotion change on October 22nd and the control drift described next, which is one reason the result is reported both ways.
During week three, the control group drifted. By October 22nd, PMAX delivery in the control states, measured over a rolling seven days, was 18% below baseline with no changes made on our side, which we attribute to automated bidding responding to something we did not change. It stayed outside the 15% rule through October 28th, bottoming out at 24% below baseline on October 23rd. The decision was to continue, document it, and report the result two ways, both raw and corrected for the drift. Delivery was back inside the rule by October 29th, and over the full window the drift was about 6%. If the missing control spend had been producing sales, then less PMAX spend in the control states means lower control sales, a lower prediction for the test states, and a smaller gap, so the drift would have understated what PMAX was doing. The correction tests that possibility: it takes the PMAX spend that went missing in the control states, assumes it would have returned somewhere between 1.3x (near Northbeam's figure for PMAX) and 3.0x (near Google's), adds that revenue back to control-state sales, and reruns the prediction, which is where the 1.23x to 1.31x figure comes from. The top of that range is deliberately generous to PMAX. It is a sensitivity analysis under assumed returns, not a second measurement, which is why 1.17x stays the primary figure.
In week four, the test states ran a few days right at prediction while the band kept widening, so the share of band fell to about 72% on October 29th before climbing to its peak on day 27, at about 80% of the way to the edge. Day 28 turned out to be the strongest day of the whole test in the paused states, which pulled the final figure back to 71%. An eight-point swing from one day's sales shows how wide the band is.
The final numbers
Measure
Value
Paused states vs expected sales
18% short
Position vs 90% noise band
71% of the way to the edge; never crossed
Confidence the shortfall is real (two-sided)
76% (90% was the bar)
Confidence the shortfall is above zero (one-sided)
88%
Incremental ROAS, as measured
1.17x
Incremental ROAS, corrected for control drift
1.23x to 1.31x
Chance the true figure is at or above 2.22x
about 1 in 7 raw, about 1 in 6 corrected
Google Ads reported, same campaigns, pre-test
2.3x to 2.8x by campaign, 2.6x blended
Northbeam (clicks-and-views model, C+DV), same campaigns, pre-test
1.4x to 1.6x blended, 1.2x to 1.8x by campaign
Measured figure as a share of the platform figure
roughly 40% to 55%, a rough haircut rather than a measured share
GA4 as a second source
same direction, about 75% of the size
The gap finished inside the 90% noise band, 71% of the way to the edge, with a two-sided confidence of 76% against the 90% we set before the test as the bar for calling it conclusive. In return-per-dollar terms the 90% range runs from roughly −0.5x to 2.8x, which takes in zero, the break-even line and Google's figure, so at that level the test rules out neither no lift nor a return above break-even. What it did show is that every leave-one-out rerun came in at or under 1.5x, the corrected central figures under 1.31x, and the chance the true number clears 2.22x is about one in seven on the raw figure and one in six on the corrected ones. The direction held in every cut; the size did not, and with the three largest contributors removed the return falls to 0.59x. For a budget decision with a 2.22x hurdle, that is enough. For a precise estimate of what PMAX returns, it is not, and the test was never sized for that.
What the test cannot say
It measures PMAX on top of the other channels as they ran in October, at October's budget, during October's promotions. It does not say what PMAX would return at a different budget, in a different season, or with a different campaign structure. It also cannot separate out the orders that ads shown before October 5th were still producing during the window, or the orders that late-October ads would have produced in November. And the state matching has one known weakness: Nebraska was running 37% to 55% above its own forecast in the ten weeks before the test, so some of its shortfall during the test may be a return to normal, and the test cannot separate that from the pause.
The two weeks of PMAX running everywhere afterward have no comparison group. So, the November check is a threshold on reported numbers with the test's haircut applied, and it is not a second measurement. The next real measurement is another holdout.
And it cannot size the one-year effect of the lost first-time customers, which is covered further down.
Why 76% was still enough to act on
This is the part of the write-up that did the most work with the client, so it gets its own section. Six reasons a 76% result was enough to make a decision on.
1. The direction held in every cut of the data, and the size did not. Leaving each of the 26 test states out one at a time gave a return between 0.96x and 1.50x across the 26 reruns, two of them under 1.0x and none above 1.5x, and every rerun's gap was positive. With the three largest contributors removed together the return falls to 0.59x, which is covered in point 4. Twenty of the 26 paused states came in under their own pre-test run-rate, scaled, compared to 14 of the 22 running states. That difference is not significant on its own (p of about 0.36), so it is a consistency check and not evidence by itself. A revenue-weighted version pointed the same way. GA4, as a second data source, pointed the same way at about three quarters of the size.
2. The question was above or below 2.22x, not the exact figure. A 28-day test at this volume cannot separate 1.17x from 1.60x with any certainty, but it can separate 1.17x from 2.22x well enough for a budget decision, which is a lower bar than proof, and the decision only needed that.
3. No version of the analysis came near the platform number. Even the most favourable rerun (1.50x) and the most favourable correction (1.31x) sit well under what Google Ads reported, and the chance the true figure is as high as the platform's lowest campaign number is under one in seven. Whatever the exact figure turns out to be, planning on the platform's figure as if it were incremental was not supported by the test.
4. Three states carried 57% of the gap, and without them the evidence of any effect gets much weaker. Michigan, Ohio and Nebraska made up under a tenth of paused-state revenue. Remove the biggest one and the return drops to 0.96x. Remove all three together and the gap is still positive, but the return is 0.59x at 38% confidence, which is not much evidence of a positive effect at all. Nebraska had also been running 37% to 55% above its own forecast in the ten weeks before the test, the largest pre-test drift of the 26 states, which raises the possibility that some of its shortfall was a return to normal rather than a PMAX effect; we cannot separate the two, and Michigan and Ohio showed no such drift. What that leaves is a test where every cut of the data came in well under the platform number and none came near 2.22x, and a test that does not pin down the size of PMAX's contribution.
5. 90% was the bar for calling it conclusive, not the bar for acting. The decision tree we wrote before launch had a branch for exactly this outcome, where the result is directionally negative but not conclusive, and that branch was "trim." Setting the bar and the branches before any data arrived is what let a 76% result drive a decision without anyone arguing about the number afterward.
6. The operational rule did its job. The control drift was disclosed to the client the week it tripped the rule, corrected for, and reported both ways.
What the lost sales were made of
First-time orders in the paused states were down about 18% relative to the running states, with a wide range (roughly 2% to 31%), and that is a different base from the 18% headline shortfall. If some of those customers would have gone on to reorder, then the one-year return on PMAX is higher than the 28-day figure. We know the direction of that effect but not the size, so it goes on the list for the next test instead of into this number.
What we decided
The result went to the owner and the finance team in their own monthly P&L format, with the recommendation on line one. On the month's numbers alone, PMAX off was the best column, and the write-up said so. Even so, we did not recommend turning it off.
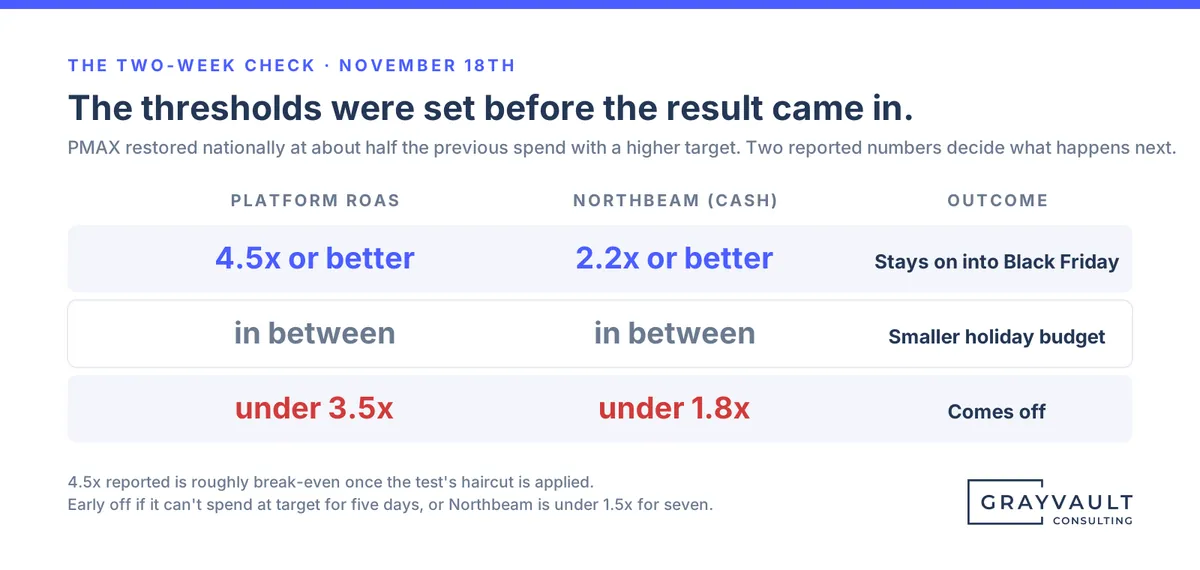
Together with the client, we decided to bring PMAX back nationally at about half the previous spend with a higher return target, and to run it as a two-week check against thresholds that were set in advance:
Stays on into Black Friday if the platform reports 4.5x or better and Northbeam (cash basis) reports 2.2x or better. The test's haircut makes 4.5x reported roughly break-even.
Comes off if it reports under 3.5x on the platform or 1.8x on Northbeam.
Comes off early if it can't spend at target for five days, or Northbeam drops under 1.5x for seven.
Anything in between gets a smaller holiday budget, not a bigger one.
The platform bar is set at roughly break-even after the test's haircut, a little under it on the raw figure and a little over on the corrected ones; the Northbeam bar is break-even on Northbeam's own reported figure, with no haircut applied. These are operating thresholds agreed with the client, informed by the test, and not break-even levels the test measured for the reduced budget. The hurdle itself does not move at half the spend. The first dollars are expected to return more than the last ones did, and the January holdout is where that gets measured. PMAX went back on in all states the morning after the decision, and the check lands on November 18th.
There were four reasons not to turn it off immediately. The result is probably real but not conclusive. Ad spend usually returns more on the first dollars than on the last ones, so half the spend at a tighter target is a cheap way to test that. Relaunching a channel cold three weeks before Black Friday is harder than turning a reduced one back up. And PMAX carries Shopping and remarketing coverage for part of the catalogue, so turning it off for good is a restructure of the account rather than a switch.
The reason not to do a full restore is simpler. At 1.17x to 1.31x against the business's margins, every net PMAX dollar was returning roughly 53 to 62 cents of contribution across the two margin bases, at October's spend, on top of the other Google campaigns, for this account.
What it feeds
The test result becomes the prior for PMAX in the marketing mix model (a statistical model of how each channel contributes to total sales), replacing the platform number, with the test's range carried in rather than the point estimate alone. This is the main reason to run a holdout even when it does not reach 90%. A model calibrated to a measured range is worth more than one calibrated to a platform number, and the calibration point does not need to be exact to be a lot better than the platform's 2.6x.
The finance team now has one number and a range, in their own format, that they can change the assumptions on.
Meta is the next channel in line for a test, and a January holdout on whatever PMAX budget survives the holidays is the follow-up.
What we learned on this account
Pre-register the bar, the stop rules and the decision branches before you start. The 76% result was usable because the branch for it already existed.
Freeze the forecast. The temptation to re-fit it on test data is strong when the number is close, and giving in to it means you can no longer trust the result.
Report it two ways when something goes wrong mid-test. Raw and corrected, both up front.
Run the robustness checks before you look at the headline number. Leave-one-out, a count of how many states in each group came in below their own pre-test run-rate (a consistency check, not evidence on its own), and a second data source.
Put the result in the client's format and currency. What is important is that the finance team can work with it in their own table, and not that it looks good in the consultancy's dashboard.
Decide what "off" actually means before you recommend it. A channel that carries placements for other formats is a restructure to remove, which is a much bigger change than flipping a switch.
Explain the band before it becomes a problem. The noise band grows with the square root of time while a real effect grows in a straight line, so a flat stretch late in a test lowers the share of band even when nothing is wrong. It is important to explain that to the client before it happens.
Say which question you answered. This test measured PMAX on top of the other Google campaigns, because that was the budget question. Total contribution from all of Google is a different test.
The platform number was not useless. It was higher than the incremental number by a ratio we have now estimated once and will check again in January, and the test turned a reported number into a calibrated one.
If you want to run one
The design above is the outline of the method. Match your markets on pre-period sales, write the rules and the decision branches down before you touch anything, take your outcome from the order system instead of the ad platform, and decide in advance what you'll do when the control group misbehaves, because in my experience it usually does. Four weeks in a quiet month was enough for a decision on a channel this size. If you'd like a second set of eyes on a design before you launch it, get in touch.
About the test
The test was run by Grayvault Consulting for an ecommerce client between October 5th and November 1st, 2026, on a matched-markets design written down and shared with the client before launch. Results were reported to the client November 2nd, the decision was made the same day, and this article was published November 3rd. Attribution on the account runs through Northbeam.
Frequently asked questions
What is a geo holdout test? A test where a channel is turned off in some markets and left on in matched ones, and the difference in sales is measured from the order system rather than the ad platform.
How long should a PMAX geo holdout run? Four weeks was enough here for a budget decision on whether PMAX was near break-even or well below it, on a channel that was about a third of total paid media spend, in a quiet month; measuring a small effect precisely takes longer.
Why did Google's number and the incremental number differ? Google Ads credits sales to its own touchpoints under the account's attribution settings, without subtracting what other channels did; the holdout measures the sales that disappear when the ads stop. On this account the measured figure was roughly 40% to 55% of the platform figure.
Can you act on a holdout that doesn't reach 90% confidence? Yes, if the decision branches were written before the data came in. Here a 76% result landed in the "trim" branch written before launch, and every rerun came in at or under 1.5x against a 2.22x break-even.