
Incrementality testing and media mix modeling
Geo holdout tests (turning a channel off in some regions and counting what goes missing) and media mix modeling, run on your own sales data. No new tracking or attribution tool required, and it works whether we run your media or someone else does. Holdout tests from $6,500 USD.
Accounts we have worked on


Why this exists
The ad platform grades its own work. An attribution tool grades the clicks and views it can see. Neither one counts the sales that would have happened anyway. A holdout does, because it measures total sales in the regions where the channel was off against the regions where it stayed on. Here is what the three looked like on one PMAX channel in October 2026.
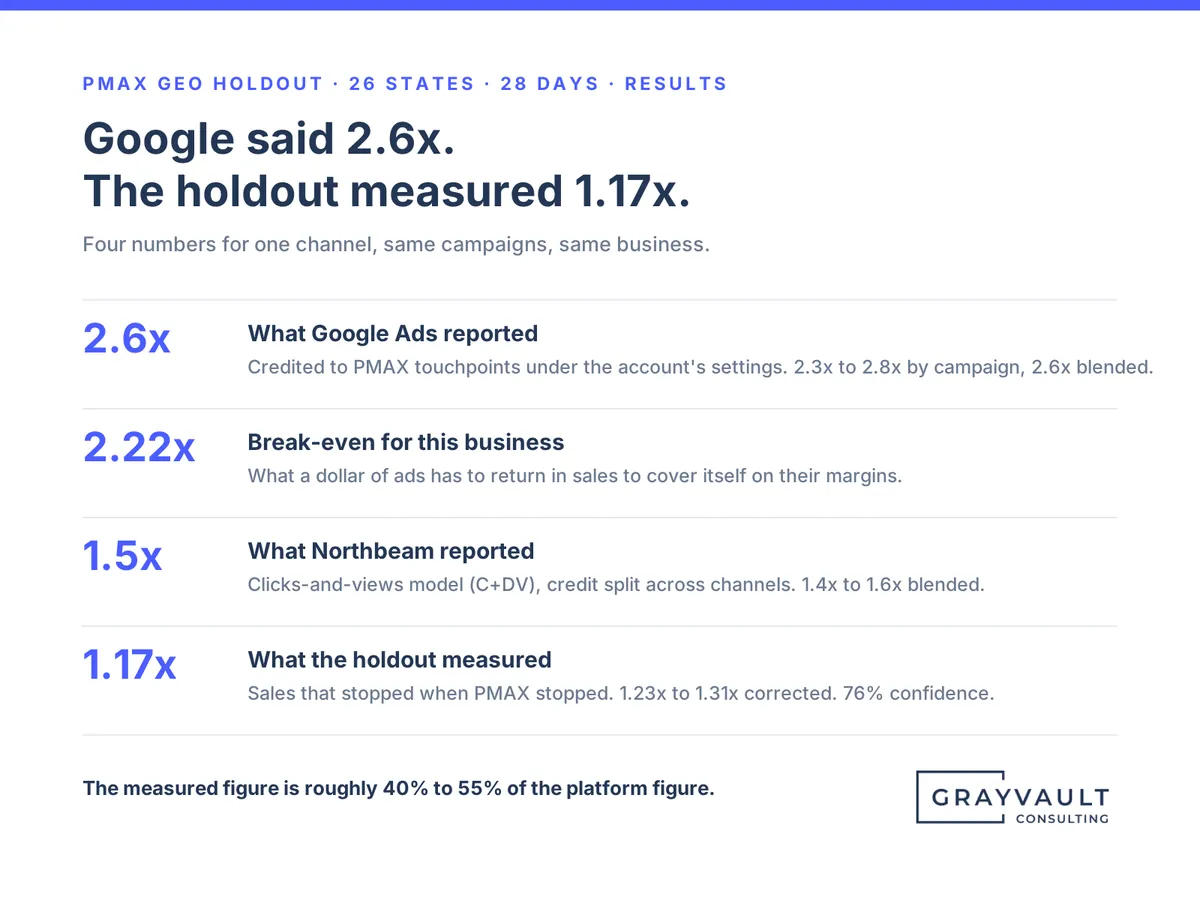
WHAT GOOGLE ADS REPORTED
2.6x
Credited to PMAX touchpoints under the account's own settings. 2.3x to 2.8x by campaign.
WHAT ATTRIBUTION REPORTED
1.4x to 1.6x
A clicks-and-views model, blended. Closer, still only counting what it could match to an ad.
WHAT THE HOLDOUT MEASURED
1.17x
Sales that went missing for every net dollar not spent, across 26 paused states over 28 days. Break-even was 2.22x.
The measured figure was roughly 40% to 55% of the platform figure. Full write-up, including what the test cannot say: PMAX geo holdout results.
What we do
Most engagements start with a single holdout on the channel with the biggest gap between the platform number and your own numbers. The model and the testing calendar come after, once there is a measured figure to build on.
A channel is paused in a matched set of regions and left running in the rest. The difference in total sales, against a forecast built before the test, is what the channel was adding.

Sizing first, so you know whether the account can get an answer before committing
Design document, decision tree and stop rules written before day one
Weekly updates during the run, results reported raw and corrected
Runs on your sales data by region. No pixels, no new tool
A statistical model of how each channel contributes to total sales, built on open-source methods and calibrated with your test results, so it starts from a measured number instead of a platform one.
Total-business model across paid, organic and seasonality
Holdout results used as priors, so the model is anchored to what you measured
Budget scenarios you can run before the next planning cycle
Refreshed as new tests land
What to test next, when the calendar allows it, and what threshold each result has to clear before budget moves. Written down before the result comes in, so the decision is not an argument afterwards.
A testing calendar that works around your peak seasons
Keep, cut and scale thresholds set per channel in advance
Platform and attribution numbers corrected against what the tests found
Works alongside your existing team or agency
Is a holdout right for your account
Below some level of daily volume the normal day-to-day swing in sales is bigger than the effect you are trying to find, and no test length fixes that. The sizing step is where we find out, before anything is turned off. A free sizing calculator is coming to the Tools section.
Enough daily sales in the regions you would pause for the gap to show above normal noise within four weeks
Sales reported by state, province or region, from your store, CRM or finance system
A quiet enough four to six week window, away from your biggest selling period
A platform number you would actually change budget on if it turned out to be wrong
Willing to turn a channel off in part of the country for the length of the test

Daily volume too low for the noise band to narrow in the time available
The only window is the middle of your peak season
Wanting an exact return to a decimal place. A holdout answers "does it clear break-even or sit well below it" far more cheaply than "what is the exact figure"
No decision attached to the result
How a test runs
Every step produces a document you keep. The design document is the one that matters most, because it is what makes a result inside the noise band usable instead of arguable.
01
Which channel, which break-even, how big the gap between the platform number and your number is, and whether the account has the daily volume to detect it. If it doesn't, we say so and stop here.
What you get
A yes or no on whether the test can answer the question
Recommended share of regions to pause and test length
About one week from the discovery call
02
The matched split of regions, the forecast model, the noise band, the early-stop line, the rule for what happens if the running regions drift on their own, and a decision tree with a branch for every outcome including the inconclusive one.
What you get
A written design you and your team sign off before day one
The decision tree, with thresholds tied to your break-even
A pre-test check that the two groups moved together historically
03
Usually four weeks. The channel is paused in the test regions, the chart updates daily, and a mid-point check decides whether to continue. Anything unexpected in the running regions is documented against the rule written in step two.
What you get
A weekly update with the running figure and the band
A mid-point check against the early-stop line
A log of anything that changed during the run
04
The measured return, reported raw and corrected, with the checks that show whether it holds when any one region is removed, and a plain statement of what the test cannot say. Then the decision the design document already committed to, and the thresholds for the next check.
What you get
Written results in your own reporting format, presented live
The budget decision and the thresholds for the next period
A measured number to anchor your model and correct your platform reporting
What it looks like in practice
ECOMMERCE, PMAX GEO HOLDOUT, OCTOBER 2026
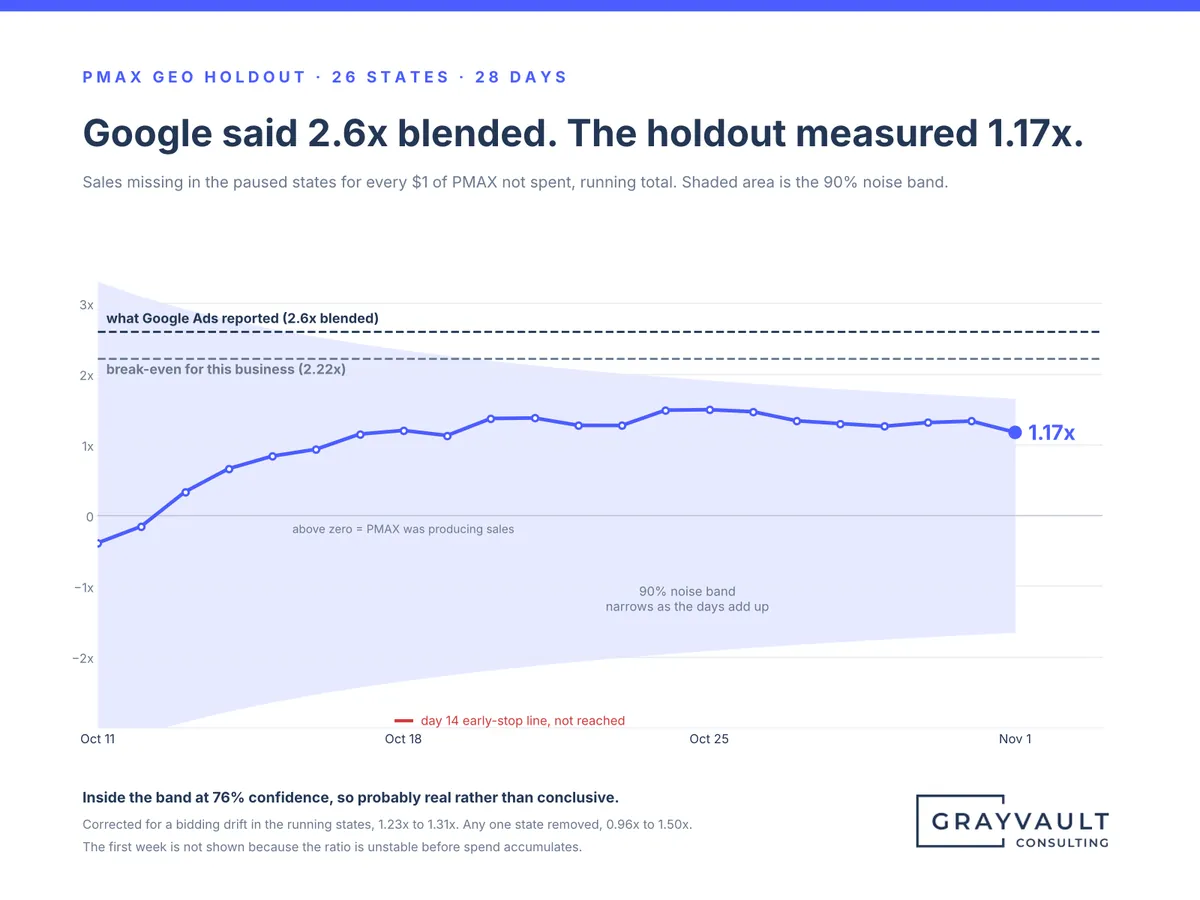
The paused states sold 18% less than predicted. The result stayed inside the noise band at 76% confidence, so it was treated as probably real, not conclusive, and the decision tree written before launch had a branch for exactly that. Together with the client we brought PMAX back nationally at about half the spend with a higher target, and the test number replaced the platform number in the marketing mix model.
1.17x
measured, against 2.6x reported
26 / 22
states paused / running
76%
confidence against a 90% bar
From the people we work with
“We’ve worked with Grayvault Consulting since 2019 and have nothing but great things to say. ... They quickly identified areas where our account was underperforming and provided actionable recommendations that made an immediate difference.”

Bryan Simpson
Co-Founder and CEO, Big Blanket Co
“Before making any changes, the team conducted a thorough audit and provided us with a detailed Playbook outlining the proposed action plan. ... The Grayvault team excels at breaking down complex Google Ads concepts in a way that’s easy to understand.”

Oksana Murashova
Senior E-Commerce Manager, HiEnd Accents & Paseo Road
“Our partnership with Grayvault Consulting has been a significant competitive advantage for OMG Commerce. ... The thoroughness of the strategic recommendations and dedication to staying ahead of industry shifts have translated directly into measurable performance gains.”

Brett Curry
Co-Founder and CEO, OMG Commerce
Pricing
A holdout is priced per test. The model is scoped once we have seen your data and at least one measured result to calibrate it with.
GEO HOLDOUT TEST
From $6,500
USD per test
One channel, sizing through to the written result and decision. Six to eight weeks end to end.
Sizing, design document and decision tree
Four-week run with weekly updates
Results reported raw and corrected, presented live
Included in ongoing management, scoped per test
MEDIA MIX MODEL
Scoped per engagement
Typically a six to eight week build, calibrated with your holdout results, then refreshed as new tests land.
Total-business model on open-source methods
Budget scenarios for the next planning cycle
Measurement planning and testing calendar included
Works whether we run the media or not
Scope above these starting points depends on the number of channels, markets and data sources.
Questions we get
Spend is the wrong number to look at. What decides whether a holdout can work is daily sales volume in the regions you would pause, and how steady it is. The sizing step answers that for your account before anything is committed. Mid-sized ecommerce accounts have run them; it is not only for the largest advertisers.
No. The test runs on your sales by region from your store, CRM or finance system. If you already have an attribution tool, the result gives you a way to check it, and the correction usually carries over between tests.
Yes. We need read access to the ad accounts, your sales data by region, and whoever runs the media to pause the channel in the test regions on the agreed date. Many teams prefer the measurement to sit with someone who is not grading their own work.
That is common on mid-sized accounts in a quiet month, and it is why the decision tree is written before the test starts. The result is reported with its confidence level, raw and corrected, and the branch for "directionally negative, not conclusive" already says what happens to the budget. The October 2026 test above is an example.
An exact return to a decimal place, effects beyond the test window, and anything about regions that were not in the test. It answers whether a channel clears break-even or sits well below it, which is the question that moves budget.
Google's open-source Meridian framework, built and calibrated by us, with your holdout results used as priors so the model starts from a measured figure. You keep the model, the data and the documentation.
A 30-minute call to look at the channel in question, your break-even and whether your account has the volume to run a holdout. If it doesn't yet, we'll tell you what would need to change.

Grayvault Consulting Inc.
Paid media and attribution for ecommerce, lead gen, and healthcare brands.
Serving organizations across North America
Based in Victoria, BC.
Founded by Craig Graham
Co-Founder and Managing Director


